Question 1 (b)

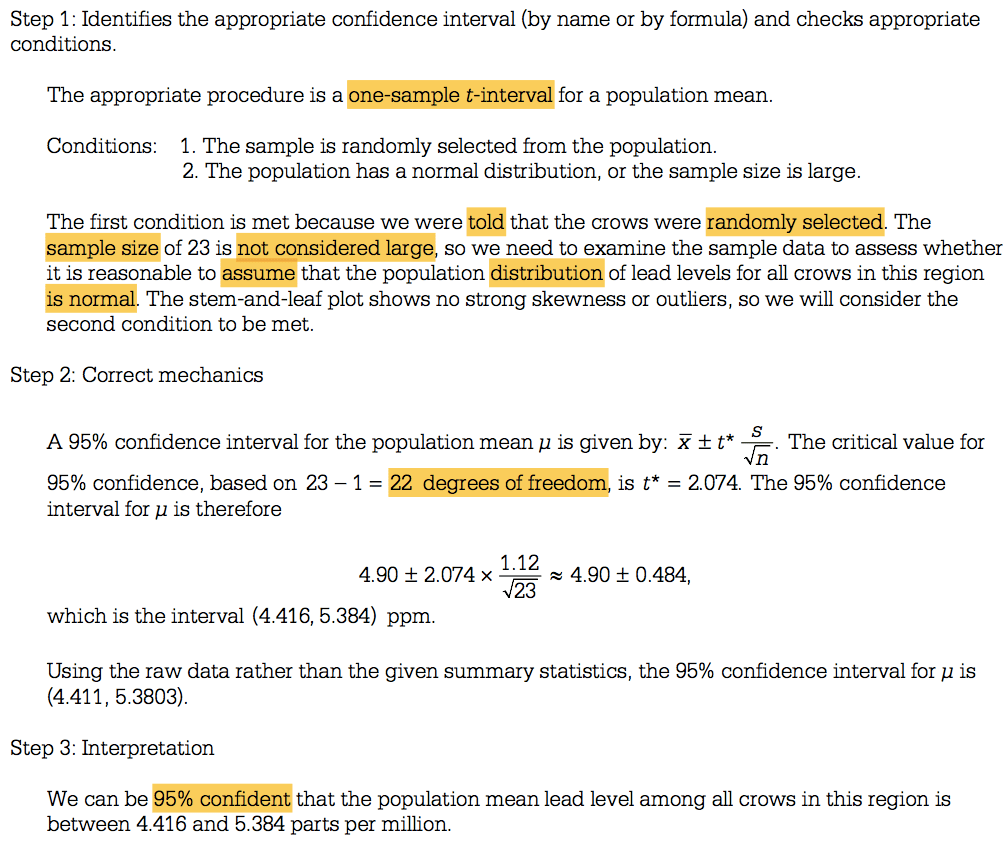
Step 1 : Identifies the appropriate confidence interval (by name or
 by formula) and checks appropriate conditions. The appropriate
 procedure is a one-sample t-interval for a population mean.
 Conditions: 1. The sample is randomly selected from the population. 2.
 The population has a normal distribution, or the sample size is large.
 The first condition is met because we were told that the crows were
 randomly selected. The sample size of 23 is not considered large, so
 we need to examine the sample data to assess whether it is reasonable
 to assume that the population distribution of lead levels for all
 crows in this region is normal. The stem-and-leaf plot shows no strong
 skewness or outliers, so we will consider the second condition to be
 met. Step 2: Correct mechanics \* \_é— The critical value for A 95%
 confidence interval for the population mean is given by: i ± t n 95%
 confidence, based on 23 — 1 = 22 degrees of freedom, is t\* = 2.074.
 The 95% confidence interval for p is therefore 4.90 ± 2.074 x 4.90 ±
 0.484, uää which is the interval (4.416, 5.384) ppm. Using the raw
 data rather than the given summary statistics, the 95% confidence
 interval for p is (4.411, 5.3803). Step 3: Interpretation We can be
 95% confident that the population mean lead level among all crows in
 this region is between 4.416 and 5.384 parts per million.

Question 2 (c)

Stratifying by campus would be more advantageous than stratifying by
 gender provided that opinions about appearance of university buildings
 and grounds between the two campuses differ more than the opinions
 about appearance of university buildings and grounds between the two
 genders.

Question 4

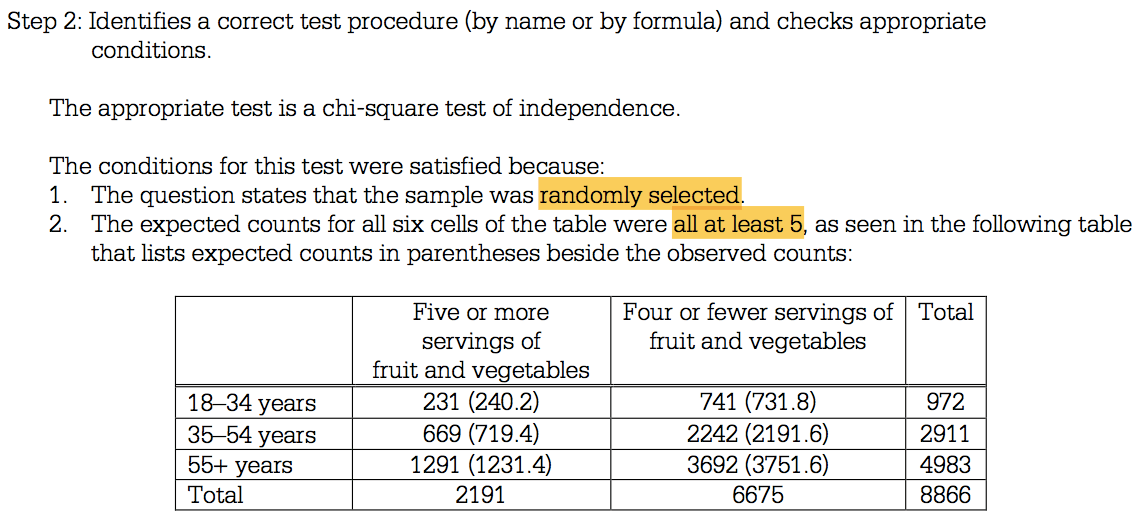
Step 2: Identifies a correct test procedure (by name or by formula)
 and checks appropriate conditions. The appropriate test is a
 chi-square test of independence. The conditions for this test were
 satisfied because: 1. The question states that the sample was randomly
 selected. 2. The expected counts for all six cells of the table were
 all at least 5, as seen in the following table that lists expected
 counts in parentheses beside the observed counts: 18—34 years 35—54
 years 55+ years Total Five or more servings of fruit and vegetables
 231 (240.2) 669 (719.4) 1291 (1231.4) 2191 Four or fewer servings of
 Total fruit and vegetables 741 (731.8) 2242 (2191.6) 3692 (3751.6)
 6675 972 2911 4983 8866

Statistic/Parameter Condition/Assumption How do we check?

More two Sample Proportions

(Test for Homogeneity)

1. Count Condition: The data are counts.

2. Independent Condition: Data in groups are independent.

3. Large sample

1. Verify this.

2. SRS and 10n < N

3. Count > 5

Step 4: States a correct conclusion in the context of the study,
 using the result of the statistical test. Because the p-value is very
 small (for instance, much smaller than a = 0.05 ), we would reject the
 null h ypothesis at the 0.05 level and conclude that the sample data
 provide strong evidence that there is an association between age group
 and consumption of fruits and vegetables for adults in the United
 States. In particular, older (55+ years of age) people were more
 likely to eat five or more servings of fruits and vegetables, and
 middle-aged people (35—54 years of age) were less likely to eat five
 or more servings of fruits and vegetables.

Question 5 (a)

No, it would not be reasonable to conclude that meditation causes a
 reduction in blood pressure for men in the retirement community.
 Because this is an observational study and not an experiment, no
 cause-and-effect relationship between meditation and lower blood
 pressure can be inferred. It is quite possible that men who choose to
 meditate could differ from men who do not choose to meditate in other
 ways that were also associated with blood pressure.

Question 5 (b)

The sample sizes were too small, relative to the overall sample
 proportion of successes, to justify using a normal approximation. One
 way to check this is to note that the combined sample proportion of
 0+8 0.286, so neither = 3.143 nor nab = 172 z 4.857 is a 8 successes
 is — - 11+17 - 28 28 28 least 1

Statistic/Parameter Condition/Assumption How do we check?

Two Sample Proportions

(Independent)

1. Randomization Condition: Samples in each group are random samples (SRS) or representatives of their populations or in experiments the treatments are randomly assigned.

2. Normality Condition: n1p1 and n2p2 ≥ 10 and n1q1 and n2q2 ≥ 10.

3. Independent Condition: The selection of each subject is independent of each other (10n < N) for each sample. In some experiments this is not necessary.

4. Independence of Groups Condition: The groups are independent of each other.

1. Based on the information provided.

2. Show that the inequalities are true.

3. Show that the inequality is true.

4. Based on the information provided.

Question 5 (c)

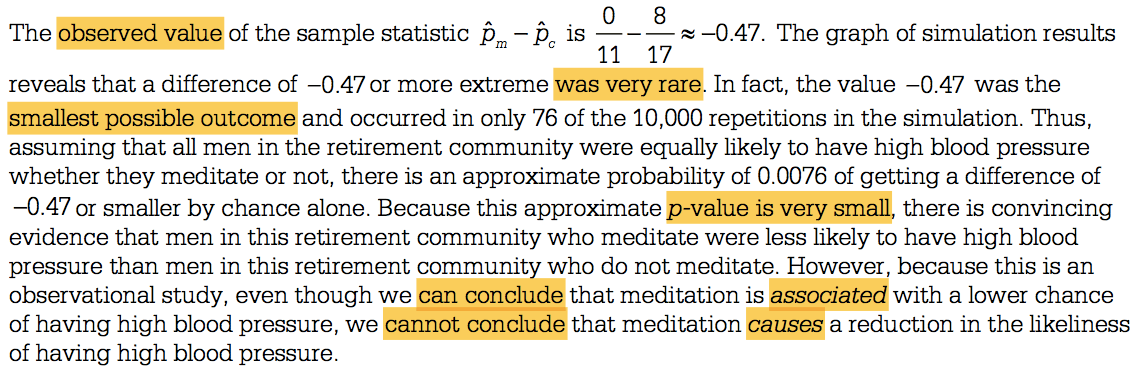
g — Y —0.47. The graph of simulation results The observed value of
 the sample statistic i m — is 11 17 reveals that a difference of —0.47
 or more extreme was very rare. In fact, the value —0.47 was the
 smallest possible outcome and occurred in only 76 of the 10,000
 repetitions in the simulation. Thus, assuming that all men in the
 retirement community were equally likely to have high blood pressure
 whether they meditate or not, there is an approximate probability of
 0.0076 of getting a difference of —0.47 or smaller by chance alone.
 Because this approximate p-value is very small, there is convincing
 evidence that men in this retirement community who meditate were less
 likely to have high blood pressure than men in this retirement
 community who do not meditate. However , because this is an
 observational study, even though we can conclude that meditation is
 associated with a lower chance of having high blood pressure, we
 cannot conclude that meditation causes a reduction in the likeliness
 of having high blood pressure.

Question 6 (a)

The Westem Pacific Ocean had more typhoons than the Eastem Pacific
 Ocean in all but one of these years. The average seems to have been
 about 31 typhoons per year in the Westem Pacific Ocean, which is
 higher than the average of about 19 typhoons per year in the Eastern
 Pacific Ocean. The Western Pacific Ocean also saw more variability (in
 number of typhoons per year) than the Eastern Pacific Ocean; for
 example, the range of the frequencies for the Western Pacific is about
 21 typhoons and only 10 typhoons for the Eastern Pacific.

results matching ""

    No results matching ""